Tuesday, June 28, 2022

Programming in GIS - Rasters


Can't See the Forest for the Slope

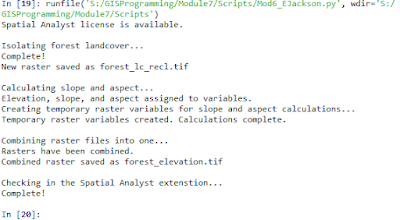
For our final lab in the GIS Programming course, we worked with rasters. For me personally rasters have always made a little more sense in GIS and coding, and bringing them together built very solidly on the skills and methods we're already learned in other modules. 

Rasters can be referenced and worked with through the arcpy.sa module, and the functions available include everything from describing to reclassifying data. This makes a fair bit of sense and seems expected after using other arcpy methods through the semester. Even if I hadn't read the textbook or lecture, I would skill have expected there to be tools that would allow me to list, name, and modify rasters as part of Python code. An unexpected callback was having to checkout the Spatial Analyst extension from the UWF ArcPro license during the standalone code. I was very grateful we had touched on that process briefly in the first module, otherwise I may have felt lost, or at least unsure why it was necessary. 

I work with rasters often by adding sidescan and sonar imagery to ArcPro maps, I am curious to see if some of the more basic changes I usually need to do during our data analysis could be accomplished through python spatial analysis tools. Particularly the step we routinely have to take to isolate just certain frequency ranges as "noise" and remove them from the displayed image.


This week's flowchart is a little more conceptual, but it was helpful in noting out the path of the code before breaking it down into individual steps.


Lessons Learned:
  • You have to put a raster in a geodatabase, or name it with a file extension
  • Keep track of your variables during calculations, it really does help to do the calculation to an intermediate "placeholder" variable
  • It is easiest to reclassify information within an existing raster to manipulate it
  • Sprinkle print statements through to track progress
  • Always doublecheck the filepath
  • Check your Spatial Analyst license
  • Rasters need to be used with a planar method
  • Raster bands and information can be called up through the arcpy.sa module


Wednesday, June 22, 2022

Programming in GIS - Geometries

A Stream of Rivers: IODs, Vertex ID, X and Y, and Names of river feature points in the rivers.shp shapefile

 In lab 5 we used what we had learned in previous weeks with search cursors and for loops, and created a series of nested for loops that allowed us to retrieve multiple levels of data brought up in a search cursor. 

A central aspect of this week's module was that data in features is stored in different tiers; features/rows, arrays, and points/vertices. While you may use a cursor to return details about features in a shapefile, if you want to get at all the way down to the points of a feature, you'll need to use several levels of for loops or special position-specific methods to get there. 

The concepts of this week's module felt fairly straightforward, and the material stacked nicely with what we learned in the past, so aside from some positioning fumbling with the method syntax I didn't have too much trouble getting the main course of the code into the editor. However, the longer the code is the more room there is for errors, and I spent probably the majority of my time on this lab editing small things. Such as trying to decipher the cause of a syntax error that I was sure I had right (turns out there was a misplaced ")" and editing and rerunning blocks of code until I had the spaces in the output in a way that made the most sense. 

The process reminds me very much of learning any spoken or written language: Once you can confidently communicate the idea, you spend a long time toying with word choice and inflection.

The other part of this lab that gave me trouble was getting every variable that needed it turned into a string with str(), so that it would be able to print into the text file. I think I finally have a better handle on that aspect though, and I have become very familiar with the "literal" error from a line of print code. 

Nesting Forbird Season: the "nested" for loops in this code allow the user to access data in different levels of a feature.

Lessons Learned:
  • If you expected multiple point pairs from your cursor and you only have one, it might be that you're only accessing an array or feature, but not the points
  • open text files with infile = open() 
  • allow python to write to text files with "w" in the open() function
  • keep in mind that you need to let things be overwritten if you're going to call the script over and over
  • the "\n" at the end of a writing for loop are crucial for keeping a text file readable
  • when in doubt, print with a str() and extra spaces
  • an insert cursor adds rows to a data file, but you can use infile.write to add cursor returns to text-based files
  • check the little things before you change the big things


Tuesday, June 14, 2022

Programming in GIS - Data Manipulation with Python


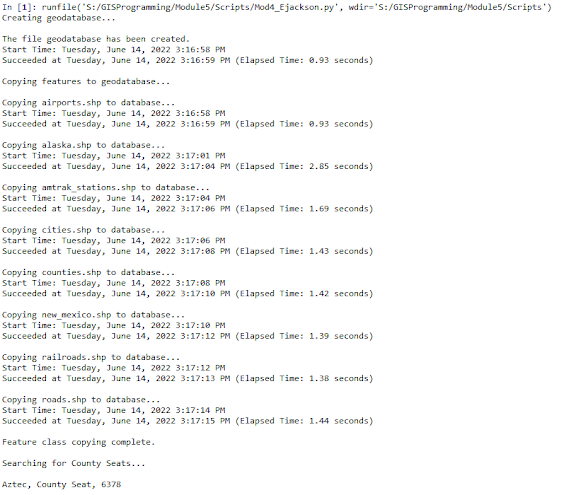
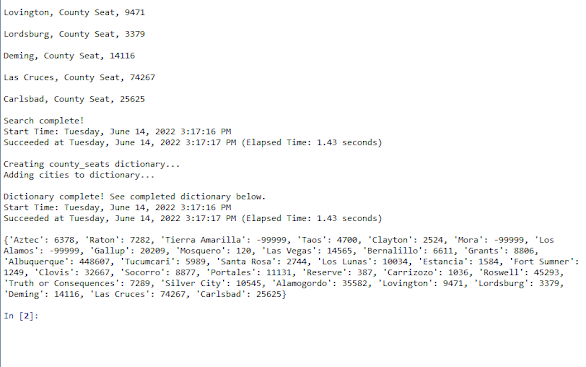
The output for Lab 4 tied together several different components that help view, organize, and edit data that can be opened in Arc programs and in Python. 


In Lab 4 we created a script that would create a new database, copy files into it from a different folder, then iterate over some of those files to find specific features using a cursor. 

The incredible usefulness of cursors in python and data management is immediately apparent, as it allows the user to automate searches and changes to large datasets that might otherwise take quite a bit of time. For what we did in the lab, it's also not necessary to open these datafiles within ArcGIS in order to view the information the cursor retrieves and edit or organize it into a new place. As a professional sometimes working on systems with slow and buggy connections to a remote GIS Desktop, I deeply appreciate the ability to manipulate GIS data files with just python. 

Some areas where I had to struggle with this script were also the places where I learned the most -the basic search cursor and dictionary syntax were available on ESRI reference material, so the lessons came largely in implementing SQL expressions and calling the right parts of the list for the printed output. 

I had originally been trying to avoid using field delimiter, because I was fairly certain I already understood how I needed to format the quotation marks in the where_clause to preserve the string format, and also make the SQL expression to select a specific subset of features. 

This was proven to be incorrect. 

After several rounds of creating variables to contain my SQL expression and tweaking quotations and parenthesis -only to receive alternating errors thrown by the where_clause and the SQL expression- I finally just added and called my column of features with arcpy.AddFieldDelimiters, then listed it in the where_clause with my SQL expression. Having it written this way immediately stopped the str and sql errors, and I will make a point of just using AddFieldDelimiters next time. 

For the most part I felt like this assignment went smoothly; even though I set it down several times to come back to it with the SQL expression. I feel like I've gotten confident enough that I know when something is wrong because I'm uncertain of the syntax, and when something is wrong but should be working, so it's likely just a typo or software issue. 

An outline flowchart of the processes used in the script for this lab. I think I will get in the habit of sketching these out beforehand for long multi-process pieces of code. 
Lessons Learned:
  • arcpy.AddFieldDelimiters is a tool for a reason, use it!
  • It's best practice to keep your for loops close to the functions they're calling from, less change you'll type something that changes the outcome in between
  • Mind your quotation marks! " and ' need to track properly though their blocks
  • \ tells python that what comes after will get special treatment, in SQL this needs to come before each of the ' string quotations 
  • When in doubt, close ArcPro and rerun the script
  • Search, Insert, and Update cursors are highly valuable tools for big datasets, make sure you check number of items before printing though
  • When copying files in python, use the basename describe tool to avoid extension and filetype errors
  • the \n is inside the quotes, or after an argument with a  +


Tuesday, June 7, 2022

Programming in GIS - Geoprocessing


Point and Buffer Telephone: The Lab 3 code output represents two geoprocessing tools, the results of which are tracked in the Spyder console by asking it to repeat the progress messages created by ArcPro.

In the third module for this course we were able to apply some of the python skills we've been working on to shape and manipulate data in ArcPro. The base concepts: code being a flowchart of processes, debugging strategies, how to identify file paths for python and ArcPro, all came to bear when we created custom toolboxes in the exercise and added new tools to them as Models, then wrote code for geoprocesses in python script. 

Models are a visual representation of the coding for a geoprocessing tool, and in Arc they can be manipulated to build custom tools, and run specific processes outside of the preset tools provided in the ArcPro user interface. Models allow the user to specify inputs and outputs in a visual format, run multipart processes with sequential outputs as one "call" and to customize the flow of a process with SQL clauses and unique arguments. All of these abilities are also available in python of course, as the models are just representations of the python backbone, but the visual display of the model is especially helpful for keeping track of different inputs and outputs. 

In the lab for Module 3 we worked entirely without the visual display to build our code. From experience it was easy to import the needed modules, set the workspace, and specify the settings I wanted arcpy to follow for my tools. From there, it was great practice to use the ArcPro reference pages that ESRI creates to build the code I needed to complete the assignment. These info pages are an incredible resource for getting the most out of the powerful tools ESRI has already created, and while the python code is provided on the page, it does take a little bit of implementation and background knowledge to call the correct variables and check for syntax errors. I say for the fourth time this year: check your classes.

Wheel, Invented & Explained: The info pages ESRI provides on their geoprocessing tools are highly valuable for someone calling these tools in python script.

The lab assignment asked us to write a code that would run the Add XY tool on a shapefile -effectively returning a series of points- and then use Buffer on each of those points to create a 1000 meter perimeter, and allow any overlapping perimeters to combine as one shape. By calling the AddXY and Buffer + Dissolve geoprocessing tools, the script created a shapefile that in the real world could be used to highlight areas around hospitals. 

Dots to Paper: The visual output of the shapefile we modified is information that could be used by city planners, emergency services, or property owners. 

When using code to call python tools through Spyder, there isn't the visual feedback of seeing the shapefile in ArcPro, or of having the flowchart in a model, so the lab asked us to add a line that would repeat information generated by ArcPro as it ran the geoprocessing tools and have the code print that information in the console. With a little cleaning up -commenting descriptions and commenting out fixed errors, the script was good to go. 

Lessons Learned:
  • Model builder is great for quick custom tools or tool modifications within Arc
  • You won't be able to add or edit tools in the default ArcPro toolbox, so make a different one for custom tools
  • If you're running a tool or code multiple times, make sure you've allowed Arc to overwrite outputs
  • C h e c k   y o u r   c l a s s e s 
  • ESRI reference pages let you see the full extent of a premade tool, as well as formatting guidelines
  • Good commenting habits will (continue) to save you from having to retype a buggy code over and over while you debug
  • (' ') or (" ") work to signify when there is an optional parameter in the line but you don't need to use it 

Wednesday, June 1, 2022

Programming in GIS - Debugging and Error Handling


Shapefile Fields Forever: Fixing errors in a script that gave us details about the different fields listed in the attribute table of a shapefile.

For the second module in our GIS Programming course we focused on strategies for debugging and handling errors in the code. I am proud to say for this section, I was finally able to apply my years of experience in, ah, navigating errors in Python. This module was also eye-opening for how difficult it is for my eyes to naturally see spelling errors in the Python script. I’m not sure if it’s the font, or the expectation that code doesn’t look like complete English, but I was surprised by the errors that it took me an entire error code to catch. Thank you Spyder Console for the assist.

In truth though, while some of the basic strategies we read and heard about for this module were fairly simple: try each line to isolate the error, try to work around the error. The tools presented and number of formalized work-arounds were actually extremely useful, and I am so glad we covered these topics this early in the course. I wish I’d had these tools for every time in the past that I’ve attempted to make a task smoother with Python.   

What’s In a Layer?: The second script we edited is one I can easily see myself recycling. Once the errors were corrected, it returns the spatial reference and layers found on a given map. 

Third try: Is The Charm! Our third edited script used statements to isolate and work around an error without removing it from the code

Using try: except: to work around an error is such a neat application and loophole [not a loop] for managing errors in Python. I think I would benefit from more practice identifying exactly where best to put the except statement, but I can see it being a vital tool for working around errors, as well as identifying them in a readable way.

Flowcharts:

I had to switch the program I was using to make flowcharts, unfortunately it means my charts are much shorter than before. This may be a good change now though to stop me from typing out every line in long blocks of code. 

Script 1 without its Stop


Unfortunately the new flowchart platform outright prevents me from using enough lines to display the for loops in Script 2 correctly. This is only a rough approximation of the flow, because there should be lines looping back to both the for statements and the eventual termination in both of the loops.


Script 3, focusing on the try statement in Part A
Lessons Learned:
  • You can use debugger and IPython to run (step) through line by line more easily than highlighting ad running individual lines
  • Don't forget to stop the Debugger tool when you want to run changes
  • When in doubt, check your spelling and capitalization
  • Generally, the except should go before the outcome, but after the end of any loops
  • Python usually does tell you what's gone wrong, and if it doesn't - IPython will

GIS Portfolio

 As a final assignment at the end of my time with University of West Florida, I have built a GIS portfolio StoryMap. The final product is em...